ggbraid provides a new stat, stat_braid(), that extends the functionality of geom_ribbon() to correctly fill the area between two alternating lines (or steps) with two different colors. ggbraid also provides a geom, geom_braid(), that wraps geom_ribbon() and uses stat_braid() by default.
Installation
You can install the development version of ggbraid from GitHub with:
# install.packages("remotes")
remotes::install_github("nsgrantham/ggbraid")
Usage
To demonstrate, let’s generate a long dataset with two alternating series.
library(ggplot2)
library(ggbraid)
library(tidyr)

set.seed(42)  # for reproducibility

n <- 21

df_long <- tibble(
  x = c(1:n, 1:n),
  y = c(rnorm(n), rnorm(n, mean = 0.5)),
  z = c(rep("a", n), rep("b", n))
)

df_long
#> # A tibble: 42 × 3
#>        x       y z
#>    <int>   <dbl> <chr>
#>  1     1  1.37   a
#>  2     2 -0.565  a
#>  3     3  0.363  a
#>  4     4  0.633  a
#>  5     5  0.404  a
#>  6     6 -0.106  a
#>  7     7  1.51   a
#>  8     8 -0.0947 a
#>  9     9  2.02   a
#> 10    10 -0.0627 a
#> # … with 32 more rows
And let’s pivot the dataset wider so we can use it with geom_ribbon() and geom_braid().
df_wide <- pivot_wider(df_long, names_from = z, values_from = y)

df_wide
#> # A tibble: 21 × 3
#>        x       a       b
#>    <int>   <dbl>   <dbl>
#>  1     1  1.37   -1.28
#>  2     2 -0.565   0.328
#>  3     3  0.363   1.71
#>  4     4  0.633   2.40
#>  5     5  0.404   0.0695
#>  6     6 -0.106   0.243
#>  7     7  1.51   -1.26
#>  8     8 -0.0947  0.960
#>  9     9  2.02   -0.140
#> 10    10 -0.0627  0.955
#> # … with 11 more rows
Now let’s draw the two series as lines and fill the area between them with a single color using geom_ribbon().
ggplot() +
  geom_line(aes(x, y, linetype = z), data = df_long) +
  geom_ribbon(aes(x, ymin = a, ymax = b), data = df_wide, alpha = 0.2) +
  guides(linetype = "none")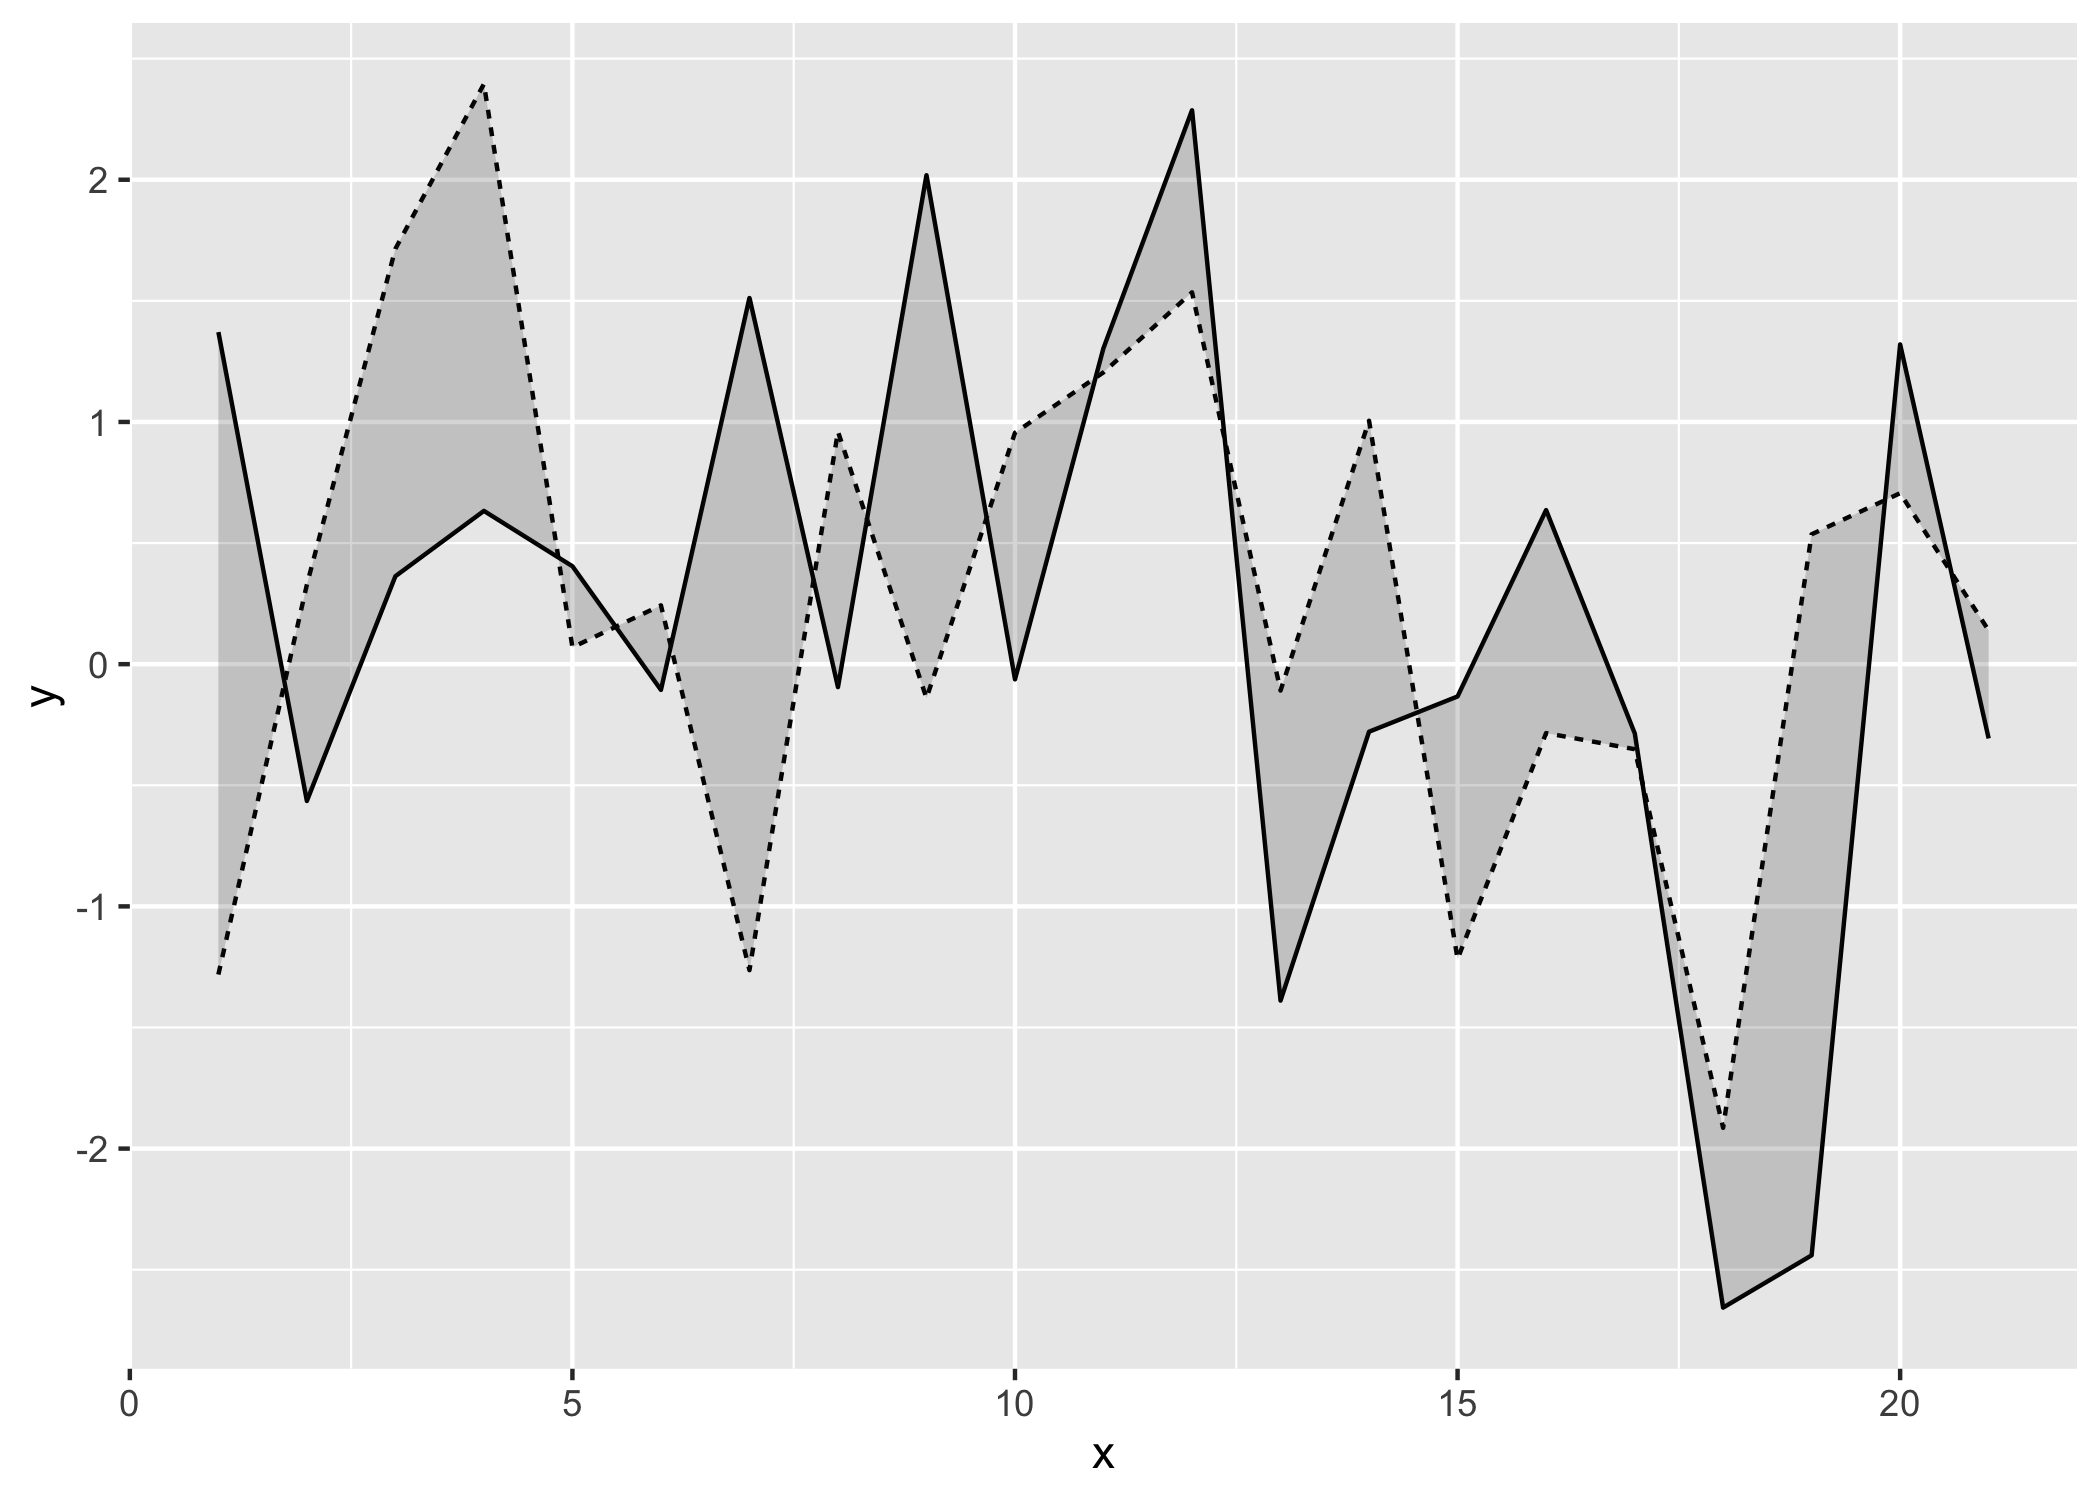
Can we fill the area between the two lines with two different colors? One color when the solid line is above the dashed line, and a different color when the solid line is below the dashed line?
That shouldn’t be hard. Let’s map a < b to the fill aesthetic in geom_ribbon() and…
ggplot() +
  geom_line(aes(x, y, linetype = z), data = df_long) +
  geom_ribbon(aes(x, ymin = a, ymax = b, fill = a < b), data = df_wide, alpha = 0.6) +
  guides(linetype = "none", fill = "none")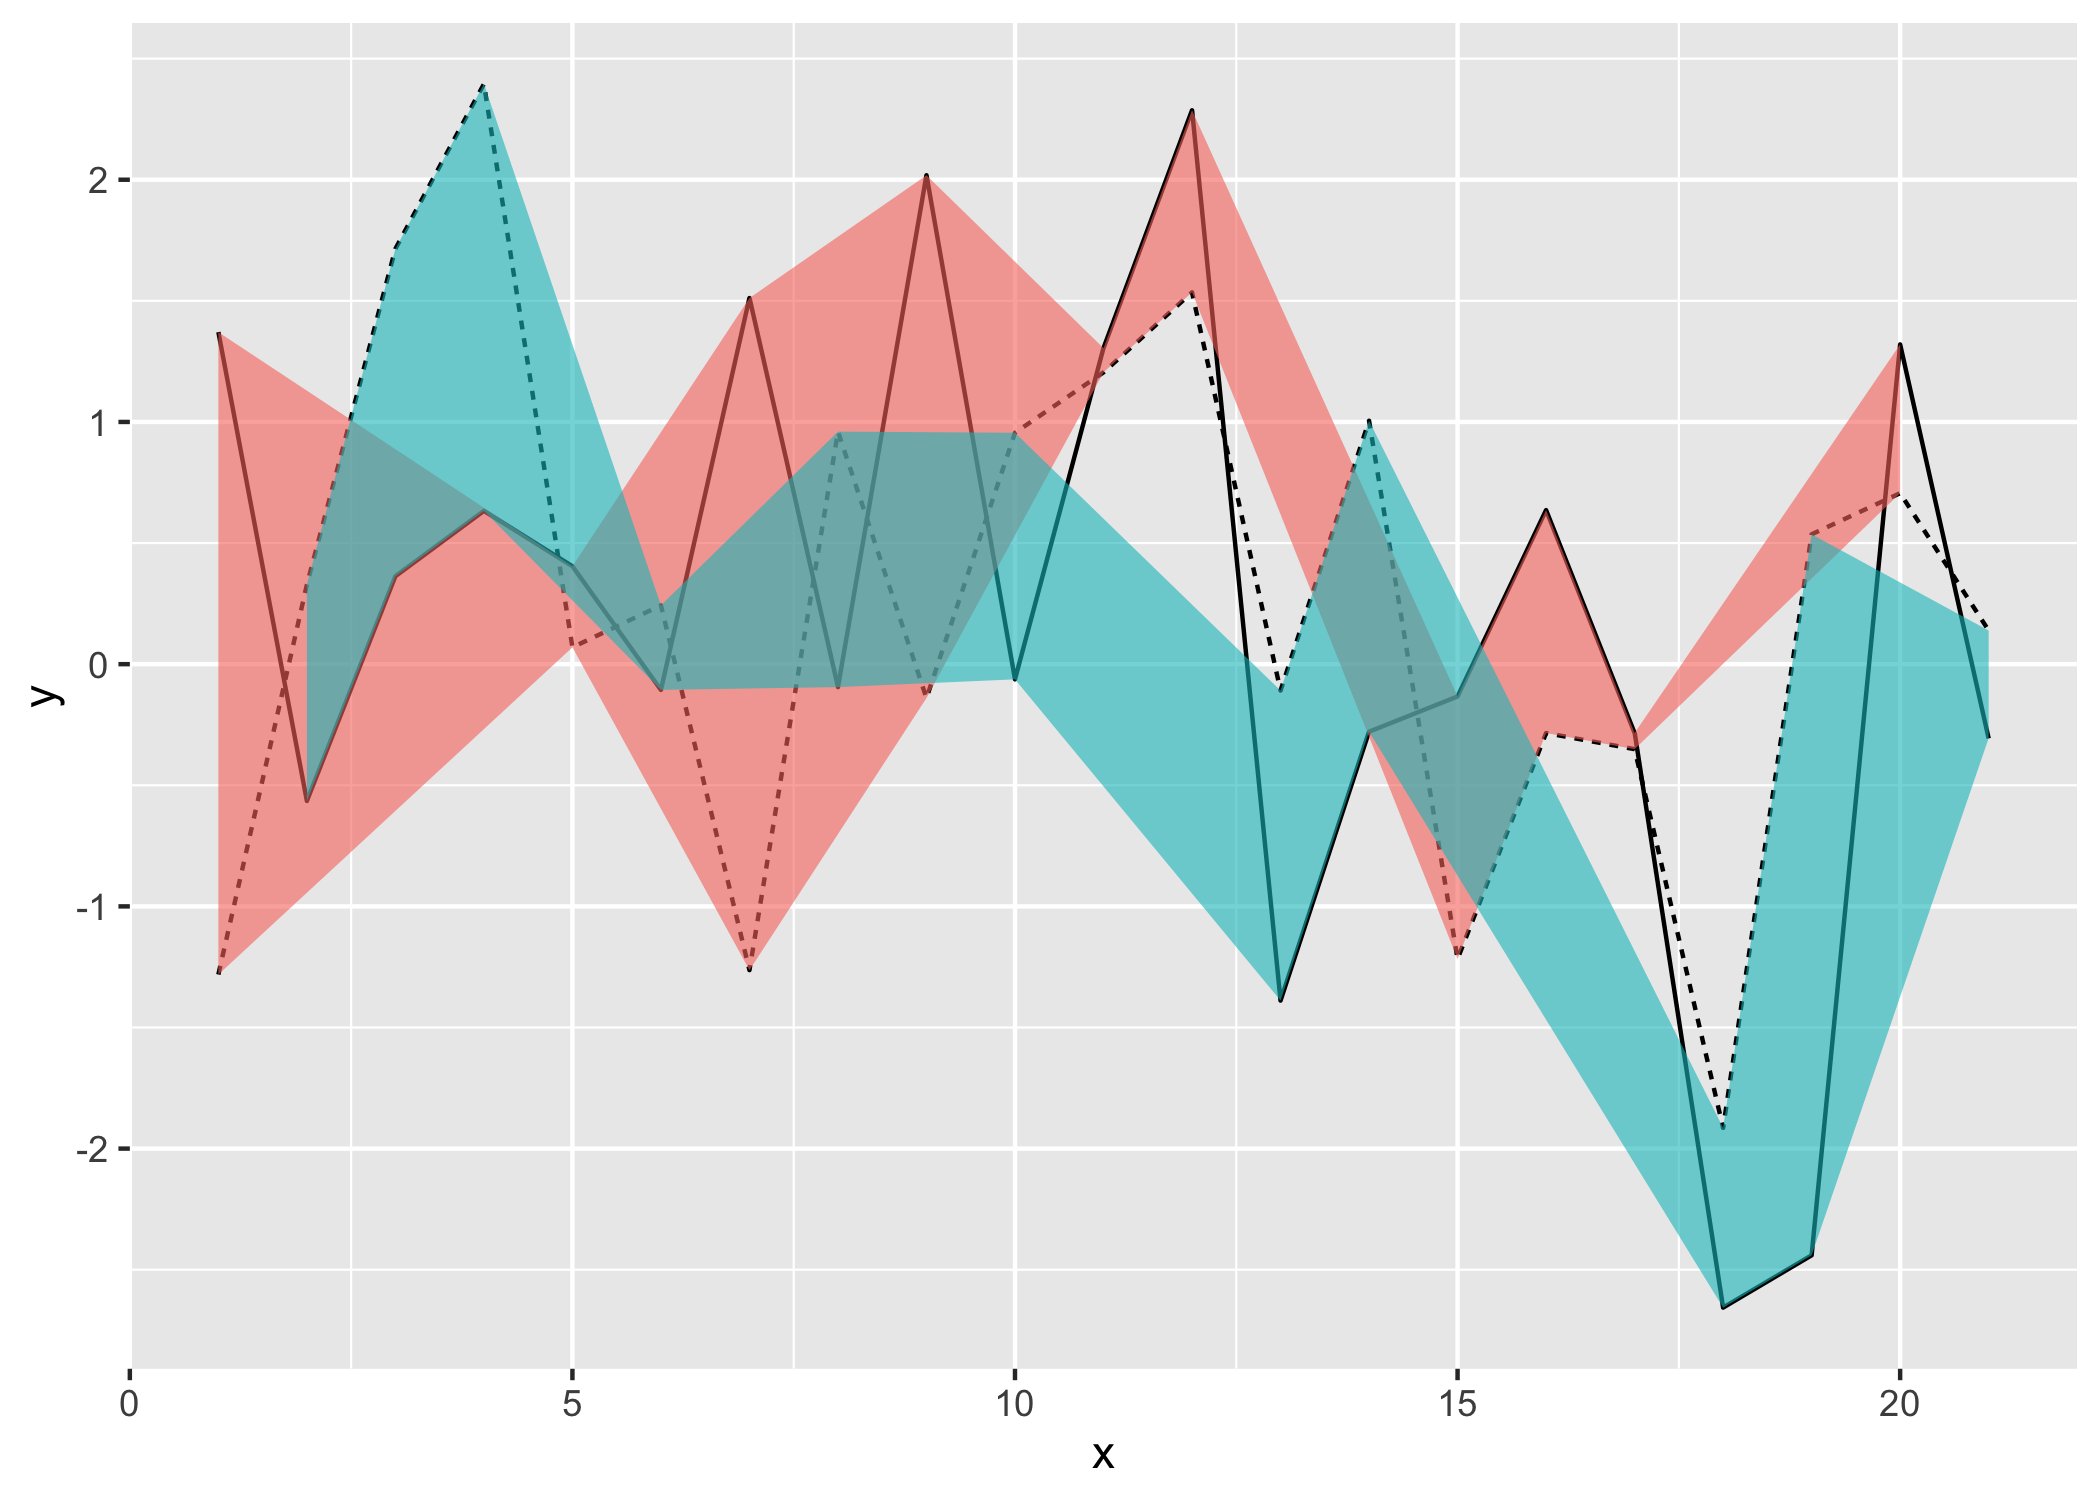
Chaos.
What happened? Is this a bug in geom_ribbon()?
No, it’s not a bug. The problem is that we haven’t dealt with line intersections properly. I call this the Unbraided Ribbon Problem.
To fix it, replace geom_ribbon() with geom_braid() from ggbraid.
ggplot() +
  geom_line(aes(x, y, linetype = z), data = df_long) +
  geom_braid(aes(x, ymin = a, ymax = b, fill = a < b), data = df_wide, alpha = 0.6) +
  guides(linetype = "none", fill = "none")
#> `geom_braid()` using method = 'line'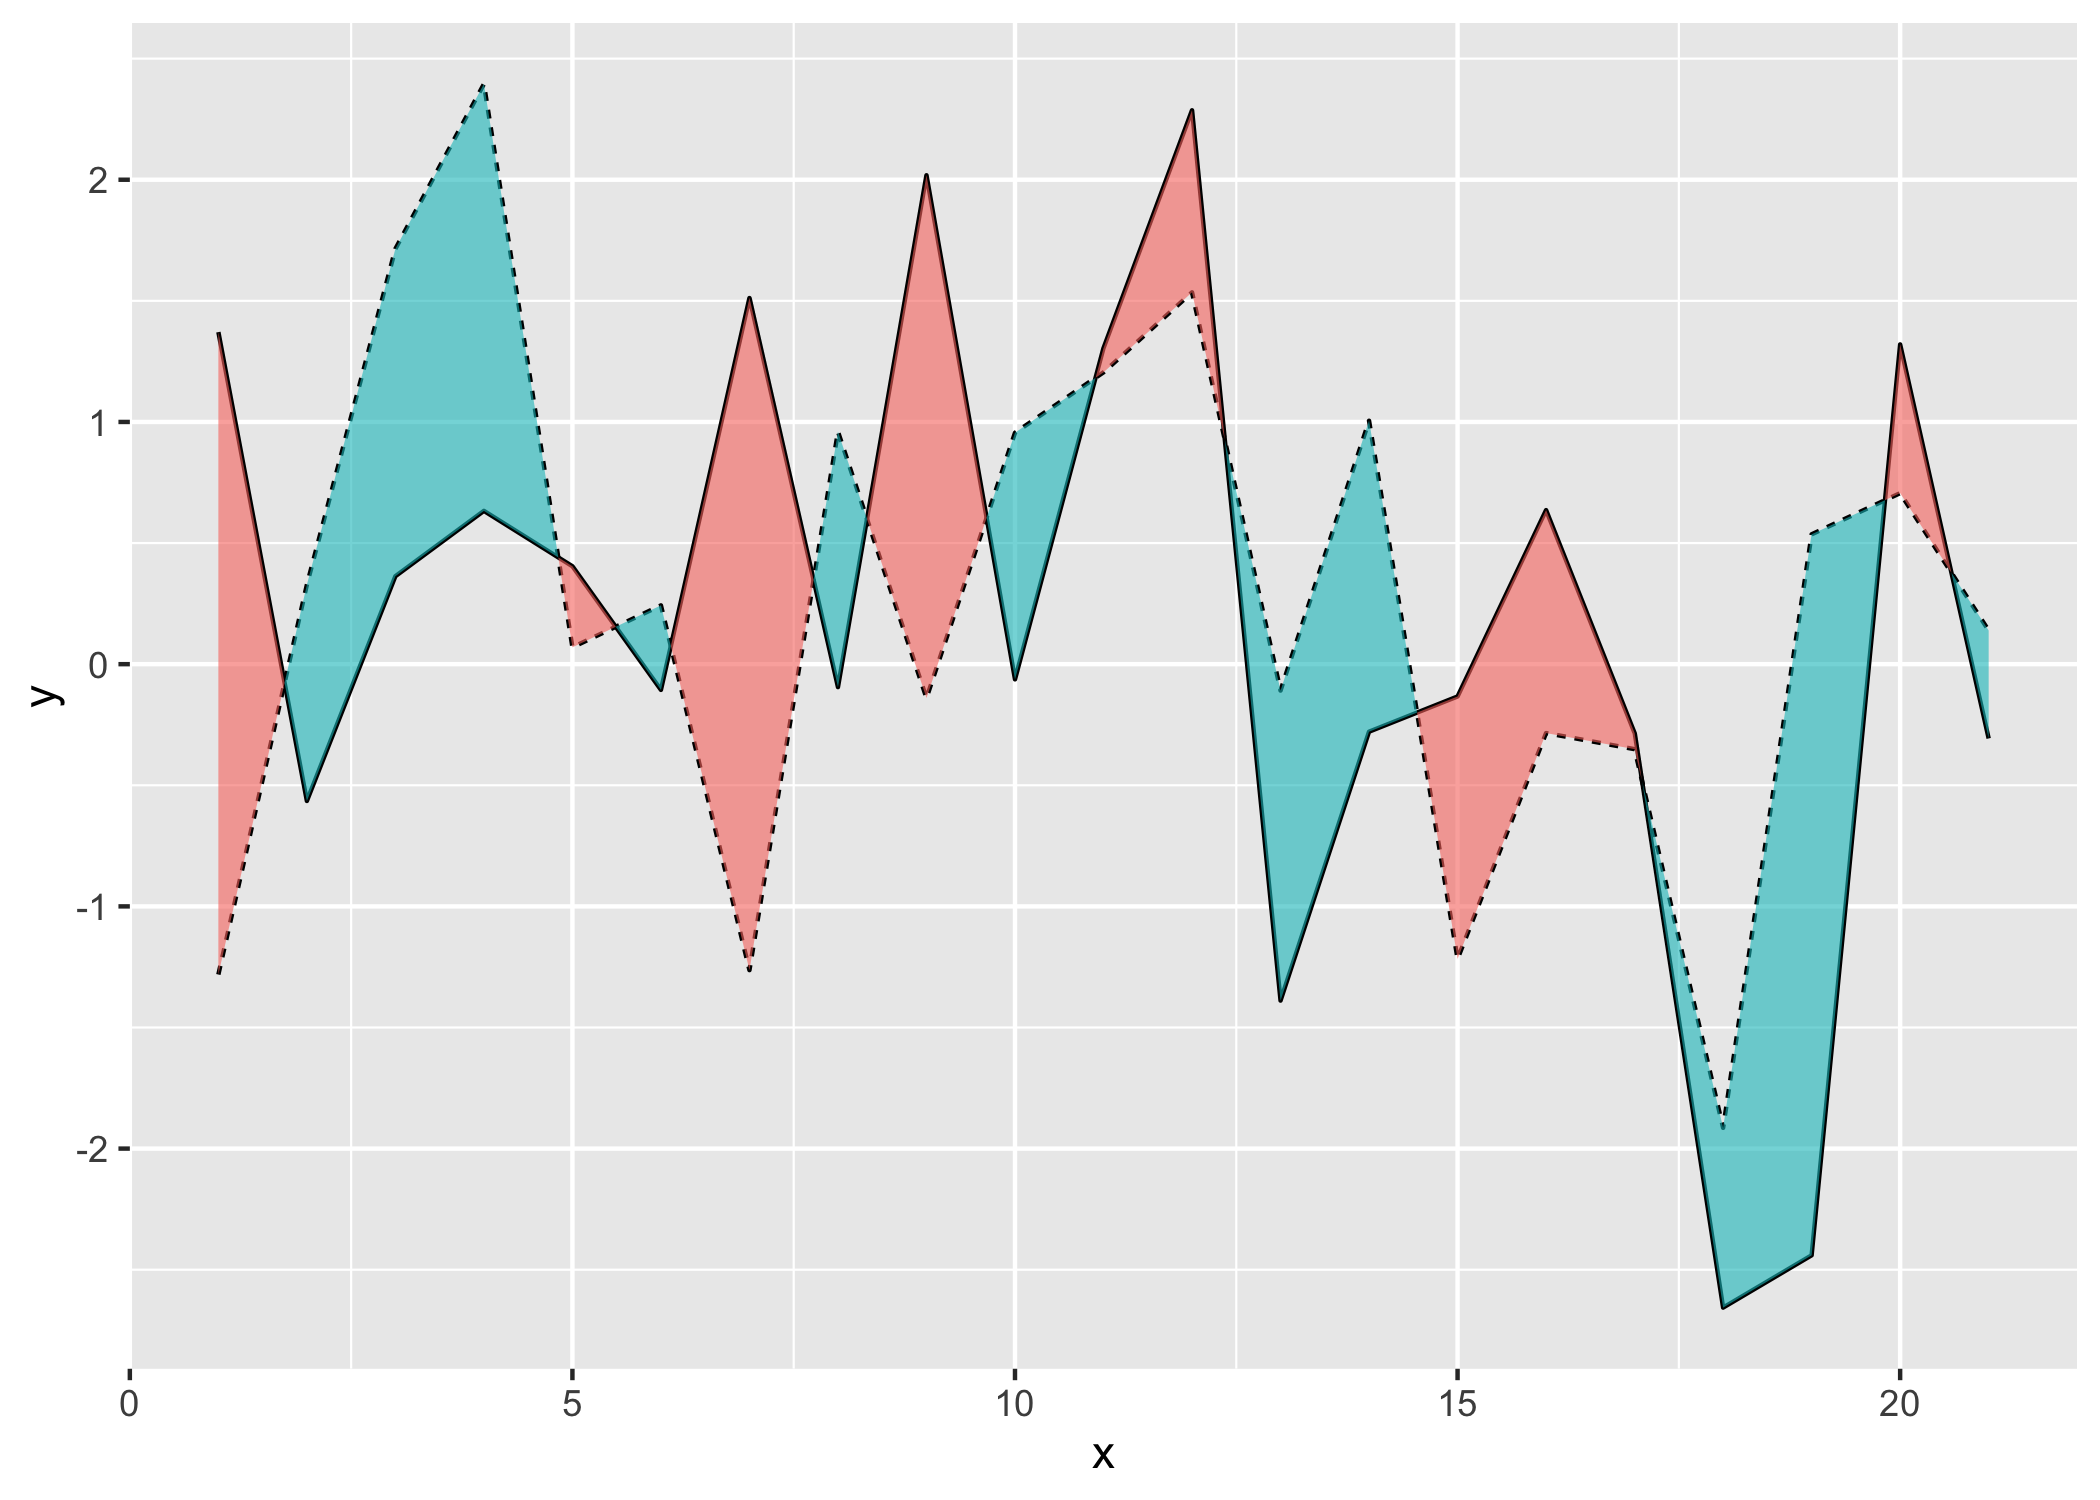
Articles
For an introduction to ggbraid and the “Unbraided Ribbon Problem”, see Average Daily Temperatures.
To learn how to use
geom_braid()withgeom_step(), see NBA Finals Game.ggbraid supports flipped aesthetics, see US Supreme Court.